
Hi folks,
As a next step of my ‘Google Summer of Code’ project- LabPlot: Theme Manager, I have added some new features in addition to the existing themes created before mid-terms. As the name suggests, its about creating more and more themes. And so, I did, but at the same time the goal is to give rich user experience.
To make the themes easily accessible to Labplot users, more options had to be provided to them in which they can apply their favorite theme(s) to the plots. For this purpose, I created an easy-to-use menu for themes called “Apply Theme” inside Cartesian Plot’s context menu. This option appears by right-clicking on the plot and so, makes it handy for the user to apply any theme on the existing plot. When a name of the theme is selected from the context menu, its properties are applied on the selected plot(s). A screenshot of the context menu is attached for your feedback.
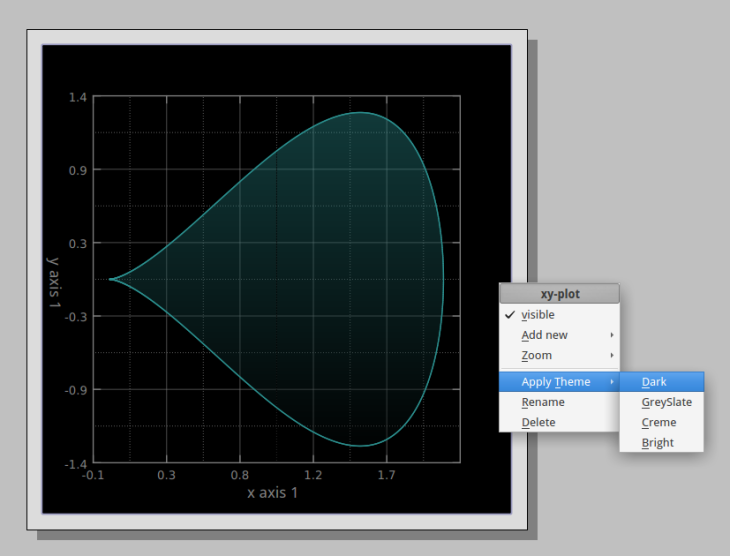
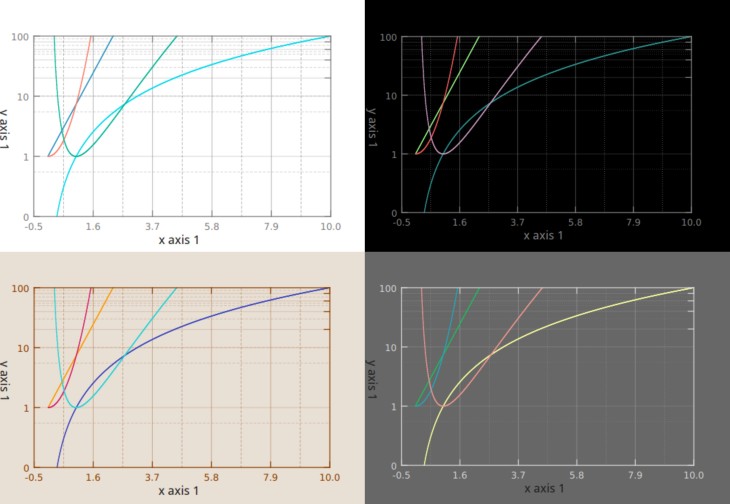
On the other hand, in addition to the already existing themes: Bright, Creme and GraySlate, there now exists a new black-colored theme! -named Dark. The theme looks really attractive and sophisticated, as shown in the screenshot (along with other 3 themes). Hope you like it. Don’t forget to try it out..
Please feel free to give your suggestions !
Thanks readers !

Cool! Are those changes part of a framework also usable by other applications (e.g. KPlotting)?
LikeLike
Thanks Sven! It’s not possible to use the code I’ve written now directly in KmPlot or Kplotting. But one
can, of course, use the color palettes I’m creating for LabPlot now also in
other programs. No general framework for handling of themes is being created
in my project now. Rather the already available infrastructure in LabPlot is
used to load and save default values for different objects. So, my task is
not to create a general framework but to create themes (KConfig files) and to
adjust LabPlot’s infrastructure to load them.
LikeLike
Nice work indeed!
Is this only about the background/axis color, or also the graph colors?
For the latter, it would be nice to have (exactly) the same options available as in Matlab, see:
http://de.mathworks.com/help/matlab/ref/colormap.html?requestedDomain=www.mathworks.com#buc3wsn-6
LikeLike
Thanks Richard! The themes are not only available for background and axis but also for the
curves. I have a color palette defined for each theme and I apply those colors to the curves according to the chosen theme.
As to the names and color palettes used in Matlab: LabPlot will have soon a very feature rich handling of different color palettes. This is currently work in progress. Those palettes will be used for coloring of 2D image like data and for coloring of 3D surfaces. For themes this is too much. Theme handling will be kept much simpler. But of course, we can get some ideas for new theme palettes by looking at the already available color palettes in other such projects.
LikeLike